User Guide
To add and name a new location click “Add Location”. Once a location has been created images taken at different time points for the same location can all be stored here.
The “Locations” page shows all the locations created by the user where images have been taken.

When you click on the new location you have just created, you will land on the “Location” page. To add a new Time Point, click the "+" button. You will be prompted to enter the date when the images were captured. Additionally, you can optionally define the range for LAI (Leaf Area Index), Canopy Cover, and Crown Porosity for more precise analysis.

Once a Time Point is created, you can begin uploading images by clicking "Add Images". You can either drag and drop the images or select files from your computer. After selecting the images, click "Upload" to start the upload process. The images will then be automatically uploaded and analysed in the background.

You can upload a maximum of 400 images at a time. Please be patient, the process requires Internet connection and the speed of it depends on your network bandwidth.
The app will now show the images being uploaded.
The app will now show the images being uploaded.

By clicking the "View Result" button on an image the results from that image can be viewed. Each image has a unique “Image id”.

To remove unwanted images from a location, select the images by clicking on the image then click "Remove Images" button.

Finally, return to the Location page by clicking the 'Back' button at the top left corner of the screen. Here, you can view the spatial distribution of the Plant Area Index (PAI) for the vineyard block on each selected date. By changing the Map Type, you can toggle between PAI, Canopy Cover, and Crown Porosity views.

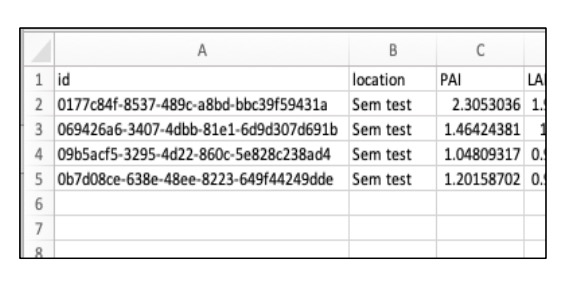
By clicking the "Export CSV" option in the left-hand menu, results can be exported as .csv files to a nominated email address. The email address used to sign into the app is used by default.
You will have to select the location you would like to export and the date.

For a better understanding of the results please refer to: De Bei, R., Fuentes, S., Gilliham, M., Tyerman, S., Edwards, E., Bianchini, N., Smith, J. and Collins, C., 2016. VitiCanopy: A free computer App to estimate canopy vigor and porosity for grapevine. Sensors, 16(4), p.585. https://www.mdpi.com/1424-8220/16/4/585
To Rename or Remove a location, click the "Edit" or "Remove" icon of a location on "Locations" page.

If you believe a result in your .csv file is not what you expected you can use the unique photo id to search for the image using "Search Image".